您的位置:好公式网 → 同花顺公式 → TY一分钟涨跌指标公式详解 同花顺涨跌
TY一分钟涨跌指标公式详解 同花顺涨跌

指标公式详细说明
好公式网(www.goodgongshi.com)告诉您:当前正要下载:TY一分钟涨跌指标公式详解 同花顺涨跌
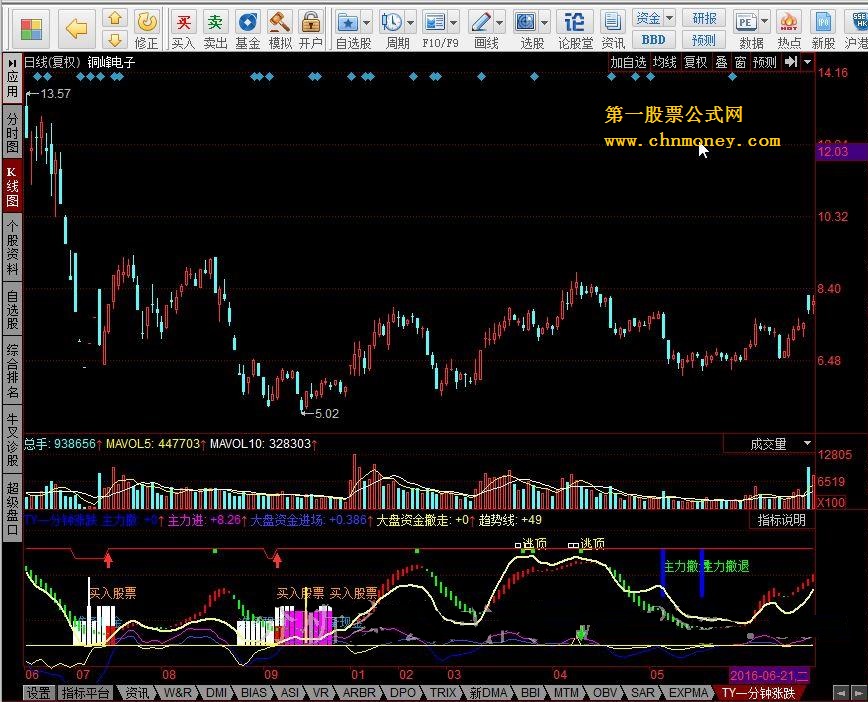
当前成交量与前5个交易日同时段的成交量平均值的比值,以判断当前是否在放量、缩量。
v1:=(c*2+h+l)/4*10;
v2:=ema(v1,13)-ema(v1,34);
v3:=ema(v2,5); v4:=2*(v2-v3)*5.5;
主力撤: if(v4<=0,v4,0),colorblue;
主力进: if(v4>=0,v4,0),colorff00ff;
v5:=(hhv(indexh,8)-indexc)/(hhv(indexh,8)-llv(indexl,8))*8;
v6:=ema(3*v5-2*sma(v5,18,1),5);
v7:=(indexc-llv(indexl,8))/(hhv(indexh,8)-llv(indexl,8))*10;
v8:=(indexc*2+indexh+indexl)/4;
v9:=ema(v8,13)-ema(v8,34);
va:=ema(v9,3);
vb:=(v9-va)/2;
大盘资金进场:if(vb>=0,vb,0),;
大盘资金撤走:if(vb<=0,vb,0),;
v11:=3*sma((c-llv(l,55))/(hhv(h,55)-llv(l,55))*100,5,1)-2*sma(sma((c-llv(l,55))/(hhv(h,55)-llv(l,55))*100,5,1),3,1);
趋势线: ema(v11,3);
v12:=(趋势线-ref(趋势线,1))/ref(趋势线,1)*100;
准备现金: stickline(趋势线<=13,0,25,10,0),colorcc9900;
aa:=(趋势线<=13) and filter((趋势线<=13),15);
drawtext (aa,30,'准备现金'),colorcc9900;
买入股票: stickline(趋势线<=13 and v12>13,0,40,10,0),color0099ff;
bb:= (趋势线<=13 and v12>13) and filter((趋势线<=13 and v12>13),10) ;
drawtext (bb,60,'买入股票'),color0099ff;
卖临界: stickline(趋势线>90 and 趋势线>ref(趋势线,1),105,100,15,1),colorffff00;
见顶清仓:=filter(趋势线>90 and 趋势线<ref(趋势线,1) and 主力进<ref(主力进,1),8);
drawtext( 见顶清仓,110,'逃顶'),coloryellow;
cc:=(趋势线>=90 and v12) and filter((趋势线>=90 and v12),10);
stickline(大盘资金进场 and 趋势线<13,0,20,10,0),colorred;
stickline(大盘资金撤走 and 趋势线>90,0,20,10,0),colorgreen;
stickline(主力进 and 趋势线<13,0,35,10,0),colorff00ff;
stickline(主力撤 and 趋势线>90,0,35,10,0),colorblue;
r0:=((if(isnull(zdmr[-1]),0,zdmr)+if(isnull(bdmr[-1]),0,bdmr))-(if(isnull(zdmc[-1]),0,zdmc)+if(isnull(bdmc[-1]),0,bdmc)))/shgzg*100;
ma5:=ma(r0,5);
中位线:=1.75;
最小值:=llv(low,10);
最大值:=hhv(high,25);
波动线:=ema((close-最小值)/(最大值-最小值)*4,4);
平均线=ema(波动线,3);
partline(0,平均线>=ref(平均线,1),colorred,平均线<ref(平均线,1),colorgreen);
主力动能:=ma(r0,5);
主力攻击:=r0-(abs(ref(r0,1))+abs(ref(r0,2))+abs(ref(r0,3))+abs(ref(r0,4))+abs(ref(r0,5))/2)>0 and 平均线>=ref(平均线,1) and ref(平均线,1)<ref(平均线,2);
主力撤退:=-((r0+(abs(ref(r0,1))+abs(ref(r0,2))+abs(ref(r0,3))+abs(ref(r0,4))+abs(ref(r0,5))/2)<0) and 平均线<=ref(平均线,1) and ref(平均线,1)>ref(平均线,2));
drawtext(主力攻击>0,主力攻击+25,"主力攻击"),colorf00ff0;
drawtext(主力撤退<0,主力撤退+89,"主力撤退"),colorgreen;
stickline(主力撤退<0,100,50,10,0),colorblue,linethick1;
stickline(主力攻击>0,0,90,10,0),colorf00ff0,linethick1;
j:= ema((close-llv(low,30))/(hhv(high,30)-llv(low,30))*100,5) ;
bias1w :=(close-ma(close,6))/ma(close,6)*100;
bias2w :=(close-ma(close,12))/ma(close,12)*100;
bias3w :=(close-ma(close,24))/ma(close,24)*100;
mm:=(bias1w+2*bias2w+3*bias3w)/6;
mn:=ma(mm,3);
var24:=llv(low,36);
var25:=hhv(high,30);
var26:=ema((close-var24)/(var25-var24)*4,4)*25;
/*股经:j,colorred,linethick1;*/
底观察:=if(mn<-4,10,0),colorliblue,linethick1;
底背离:if((var26<10),90,100), colorred,linethick1;
顶背离:if((var26>90),10,0), coloryellow,linethick1;
drawicon(var26>10 and ref(var26,1)<10,95,1);
drawicon(var26<90 and ref(var26,1)>90,5,2);
/*lc:=ref(c,1);
wrsi:=sma(max(c-lc,0),9,1)/sma(abs(c-lc),9,1)*100;
drawicon(cross(20,wrsi),c,1);
drawicon(cross(wrsi,80),c,2);*/
rsv:=(close-llv(low,9))/(hhv(high,9)-llv(low,9))*100;
k:=sma(rsv,3,1);
d:=sma(k,3,1);
j:=3*k-2*d;
varv:=(2*c+h+l)/4;
varu:=llv(low,30);
vara1:=hhv(high,30);
b:=ema((varv-varu)/(vara1-varu)*100,8);
b1:=ema(b,5);
stickline(b-b1>0,b,b1,8,1),colorred;
stickline(b-b1<0,b,b1,8,1),color00ff00;
lc:=ref(close,1);
rsi:=sma(max(close-lc,0),6,1)/sma(abs(close-lc),6,1)*100;
低吸:=if(cross(rsi,11),70,0),colorwhite,pointdot;
stickline(低吸,70,0,4,0),colorwhite;
var7:=ema(amount/vol/100,3);
var8:=ema(var7,88);
var9:=ema(var7,88)*0.85;
vara:=var9*0.87;
varb:=low<vara and close>ref(close,1)*1.02;
stickline(filter(varb,6),65,0,4,0),colorff00ff;
坚决买进:=if(filter(varb,6),65,0),colorff00ff,pointdot;
varf:=(2*close+high+low)/4;
va4:=llv(low,34);
va5:=hhv(high,34);
va6:=ema((varf-va4)/(va5-va4)*100,6);
va7:=ema(0.667*ref(va6,1)+0.333*va6,4);
出击:=if(if(count(close<ref(close,1),8)/8>0.3 and count(va6>va7,3) and ref(low,1)=llv(low,120) and
close>open,1,0),1,0),coloryellow,pointdot;
stickline(if(count(close<ref(close,1),8)/8>0.3 and count(va6>va7,3) and
ref(low,1)=llv(low,120) and close>open,1,0),60,0,4,0),coloryellow;
a:=(3*close+low+open+high)/6;
d1:=(20*a+19*ref(a,1)+18*ref(a,2)+17*ref(a,3)+16*ref(a,4)+15*ref(a,5)+14*ref(a,6)
+13*ref(a,7)+12*ref(a,8)+11*ref(a,9)+10*ref(a,10)+9*ref(a,11)+8*ref(a,12)
+7*ref(a,13)+6*ref(a,14)+5*ref(a,15)+4*ref(a,16)+3*ref(a,17)+2*ref(a,18)+
ref(a,20))/211;///www.goodgongshi.com
d2:=ema(d1,2);
d3:=ema(d2,2);
k1:=ema(d3,2);
多方趋势:=7*sma((close-llv(low,27))/(hhv(high,27)-llv(low,27))*30,4,1)
-3*sma(sma((close-llv(low,27))/(hhv(high,27)-llv(low,27))*30,4,1),3,1)
-sma(sma(sma((close-llv(low,27))/(hhv(high,27)-llv(low,27))*30,4,1)
,3,1),2,1);
天线:=78.89;
stickline(cross(天线,多方趋势),95,100,10,0),color00ff00;
>>>使用本站搜索工具可以找到更多“TY一分钟涨跌指标公式详解 同花顺涨跌”
指标公式下载地址
好公式网提供全网最全的指标公式软件,感谢您的支持!鼠标双击图片可看大图!下载请点击右侧“立即下载”,如只有源码,请点击本页面右侧的导入方法按图导入!
本站指标基于网友分享,仅供研究自学,勿作他用,本站对下载使用不承担任何责任!
上一指标公式:量能生命线指标公式详解 同花顺量能
下一指标公式:主力资金进场抄底指标公式详解 同花顺进场主力
相关同花顺公式推荐
同花顺趋势逢低追涨副图指标 逢低买入追涨 源码 效果图
同花顺短底追击买入副图指标 短期底部反弹出手 源码 效果图
【智能强势抄底】副图指标,强势区间抄底,弱势区间逃顶,通达信 源码
连阳首阴缩量战法副图/选股指标 量价关系定量模型 通达信 源码
主力量学主图指标 量学二一阻力 为阻力位做标记 通达信 源码
仁者心动买卖分时副图指标 独创博弈动机分时T+0指标 通达信 源码
心想事成副图指标 精准预测分时买卖时机 通达信 源码
底部涨停买副图/选股指标 短中线超准买点 通达信 源码
筹码变化改版副图指标 埋伏在起涨前的公式 通达信 无未来 源码
预警信号幅图指标 第一次发指标 通达信 源码 不限时
龙头竞价分时指标 专做一进二集合竞价打板 好用的t0指标分享 通达信 源码
也发个迸凑的【迸凑一进二】竞价指标 回测3天 效果还不错 通达信 源码
自用《资金博弈终结》副图指标 看透庄家 多头行情赚到吐 成功率90%以上 可验证
弘历鱼跃龙门副图/选股指标 弘历涨停模型 通达信 源码 无密
同花顺资金牛股买入点副图指标 金牛线下出橙色柱可关注 源码 效果图
指标公式下载注意
☉ 好公式网发布的指标公式主要用于软件技术面分析,仅供参考,勿用于实际操作,据此操作风险自负!
☉ 解压密码:www.goodgongshi.com 就是好公式网域名,希望大家看清楚,切勿输错。
☉ tnc和tni格式指标公式,仅可以用通达信软件引入使用,例如可以用通达信软件引入使用指标公式;
☉ tne格式指标公式,仅可以用通达信软件公式编辑器5.0版导入,高版本兼容低版本;
☉ fnc格式指标公式,可以用大智慧软件新一代高速行情分析系统股票软件使用,少部分可以用分析家软件引入使用;
☉ alg格式指标公式,仅仅可以用飞狐交易师软件引入使用;exp格式指标公式,仅可以用大智慧经典版软件引入使用;
☉ hxf格式指标公式,仅可以用同花顺软件引入使用。
☉ 如果您发现下载软件链接错误,请联系管理员报告错误。
☉ 好公式网欢迎各位网友帮忙宣传转发本站网址,有您的支持,我们会做得更好!
☉ 本文TY一分钟涨跌指标公式详解 同花顺涨跌仅供学习研究。
 粤公网安备 44010602010581号