自用指标MADX指标(主图 通达信 贴图)逢低关注区买进,高抛风险区避险下载
- 指标公式类型:通达信公式
- 公式推荐星级:

- 指标公式安全:已通过5款杀毒软件查杀,请放心下载!
- 公式更新时间:2021-01-13 08:28:57
- 指标公式标签:
- 公式运行环境: WinXP/Win7/Win8/Win10/Win All
- 指标公式语言:用简体中文编写
指标公式详细说明
好公式网(www.goodgongshi.com)告诉您:当前正要下载:自用指标MADX指标(主图 通达信 贴图)逢低关注区买进,高抛风险区避险下载
自用指标madx指标(主图 通达信 贴图)逢低关注区买进,高抛风险区避险源码下载:
ma1:ma(close,1);
ma5:ma(close,5);
if(ma5>ref(ma5,1),ma5,drawnull),colorred,linethick5;
ma20:ma(close,20),linethick2,coloryellow;
upper:(1+11/100)*ma(close,10),colorgreen;
lower:(1-9/100)*ma(close,10),colorgreen;
ene:(upper+lower)/2,colorgreen;
zma5:=ma(c,5);
bbma10:=ma(c,10);
yc0x1:=zma5>=ref(zma5,1);
h02:=max(zma5,bbma10);
l02:=min(zma5,bbma10);
zjpb2:=(c-ref(c,1))/ref(c,1)*100;
穿二线:=h02<c and o<l02 and yc0x1 and zma5>ref(zma5,1) and zjpb2>3;
stickline(穿二线,o,c,0.80,0),colorbrown;
角度10:=atan((ma(c,10)/ref(ma(c,10),1)-1)*100)*57.3;
选股:=(角度10>=1 {现在是1度,角度可调} and 穿二线);
stickline(选股,o,c,1.180,0),color0000ff;
stickline(选股,o,c,0.50,0),color00ffff;
drawtext(选股,l*0.98, '穿二线'),coloryellow;
kc:=forcast(((2*c+h+l)/4*0.618+c*0.382),3);
aax:=(kc-ma(kc,9))/ma(kc,9)*100;
var0:=min(exist(kc,55),9);
aax1:=ema(aax,var0)*var0;
aax2:=ma(aax1,3);
aax3:=ma(aax1,5);
卖:=aax3>3 and aax1<ref(aax1,1) and cross(aax2,aax1);
vba:=filter(卖,5);
drawtext(vba,h*1.05,'★卖'),colorgreen;
{好公式网-最好的股票公式网站 www.goodgongshi.com}
vb2:=ema(ema(c-ref(c,1),6),6)/ema(ema(abs(c-ref(c,1)),6),6)*100;
vb3:=if(llv(vb2,3)=llv(vb2,11) and count(vb2<0,2) and cross(vb2,ma(vb2,2)),1,0);
vb4:=filter(vb3=1,5);
drawtext(vb4,l*0.97,'★买'),colorred;
stickline(vb4,close,open,2,0), coloryellow ;
stickline(vba,close,open,2,0),colorcyan ;
mac3:=(atan((ma(c,3)/ref(ma(c,3),1)-1)*100)*180/3.14115926);
m3:=ma(mac3,3);
aa:=ployline(cross(mac3,m3),m3);
aab:=ployline(cross(m3,mac3),mac3);
买二:=count(cross(mac3,m3),aa<ref(aa,3) and aab>ref(aab,3));
drawtext(买二,l*0.97,'★买二'),colormagenta;
zt:=c/ref(c,1)>1.097;
xh:=filter(zt,13);
bh:=barslast(zt);
cz:=ref(h,bh)-ref(l,bh);
stickline(c,(ref(l,bh)+cz*0.5),(ref(l,bh)+cz*0.5),7,0),coloraa00aa;
stickline(c,ref(l,bh),ref(l,bh),5,0),color2f73ff;
stickline(zt,ref(o,bh),ref(c,bh),5,0),coloryellow;
drawtext(zt,l*0.98,'★涨停'),color4080ff;
varzt:=barslast(c/ref(c,1)>1.097);
stickline(varzt=2,l*0.97,l*0.98,1,0),color666666;
drawtext(varzt=2,l*0.95,'3天'),colorffffff;
stickline(varzt=4,h*1.03,h*1.02,1,0),color666666;
drawtext(varzt=4,h*1.06,'5天'),colorffffff;
stickline(varzt=7,l*0.97,l*0.98,1,0),color666666;
drawtext(varzt=7,l*0.95,'8天'),colorffffff;
stickline(varzt=12,h*1.03,h*1.02,1,0),color666666;
drawtext(varzt=12,h*1.06,'13天'),colorffffff;
stickline(varzt=20,l*0.97,l*0.98,1,0),color666666;
drawtext(varzt=20,l*0.95,'21天'),colorffffff;
stickline(varzt=33,h*1.03,h*1.02,1,0),color666666;
drawtext(varzt=33,h*1.06,'34天'),colorffffff;
stickline(varzt=54,l*0.97,l*0.98,1,0),color666666;
drawtext(varzt=54,l*0.95,'55天'),colorffffff;
stickline(varzt=88,h*1.03,h*1.02,1,0),color666666;
drawtext(varzt=88,h*1.06,'89天'),colorffffff;
stickline(varzt=143,l*0.97,l*0.98,1,0),color666666;
drawtext(varzt=143,l*0.95,'144天'),colorffffff;
stickline(varzt=232 ,h*1.03,h*1.02,1,0),color666666;
drawtext(varzt=232,h*1.06,'233天'),colorffffff;
stickline(varzt=376,l*0.97,l*0.98,1,0),color666666;
drawtext(varzt=376,l*0.95,'377天'),color666666;
n:=120;
kk:=barslast(currbarscount=n);
gd:=const(if(islastbar=1,hhv(h,kk),0));{高点}
dd:=const(if(islastbar=1,llv(l,kk),0));{低点}
kj:=gd-dd;{高低点差值=分区高度}
{三直线}
stickline(currbarscount=n,gd,dd,0,0),colorgreen;
stickline(currbarscount=n/2,gd,dd,0,0),color408080;
stickline(currbarscount=1,gd,dd,0,0),colorgreen;
高区:if(currbarscount<=n/2,gd,drawnull),colorred,linethick2;
drawtext(currbarscount=1,高区*0.99,' 高区'),colorred;
低区:if(currbarscount<=n/2,dd,drawnull),color00ff00,linethick2;
drawtext(currbarscount=1,低区,' 低区'),colorred;
平衡:if(currbarscount<=n,dd+kj/2,drawnull),color00ffff;
{drawtext(currbarscount=1,平衡,' 平衡'),colorgreen;}
低:if(currbarscount<=n/2,dd,drawnull),colorffff00;
高:if(currbarscount<=n/2,gd,drawnull),color00ffff;
支撑:=if(currbarscount<=n/2,dd+kj*0.191,drawnull),color00ffff;
drawtext(currbarscount=1,支撑,' 支撑'),color00ffff;
stickline(currbarscount<=n/2,支撑,支撑,2,0),colorff00ff;
强势:=if(currbarscount<=n/2,dd+kj*0.382,drawnull),colorff00ff;
drawtext(currbarscount=1,强势,' 强势'),colorgreen;
突破:if(currbarscount<=n/2,dd+kj/2,drawnull),color0000ff;
drawtext(currbarscount=1,突破,' 突破'),colorgreen;
stickline(currbarscount<=n,强势,强势,2,0),colorff00ff;
警示:if(currbarscount<=n/2,dd+kj*0.618,drawnull),color00ffff;
drawtext(currbarscount=1,警示,' 警示'),colorgreen;
压力:=if(currbarscount<=n/2,dd+kj*0.809,drawnull),color00ff00;
drawtext(currbarscount=1,压力,' 压力'),colorgreen;
stickline(currbarscount<=n/2,压力,压力,2,0),color00ffff;
低涨:=if(currbarscount<=n/2,(c/llv(low,kk)-1)*100,drawnull),color0000ff,nodraw;
天数:barslast(l=dd),colorcyan,nodraw;
顶点:if(currbarscount<=n, const(if(islastbar=1,hhv(h, barslast(currbarscount=60)),1)),drawnull),colorred,crossdot;
stickline(cci>=200 and h>=顶点,o,c,2,0),colorblue;
低点:if(currbarscount<=n, const(if(islastbar=1,llv(l, barslast(currbarscount=60)),1)),drawnull),colormagenta,crossdot;
stickline(cci<=100 and l<=低点,o,c,2,0),coloryellow;
{drawband(高区,rgb(120,20,0),强势,rgb(0,0,0));
drawband(强势,rgb(80,0,100),低区,rgb(0,0,0));
drawband(高,rgb(100,100,0),压力,rgb(0,0,0));}
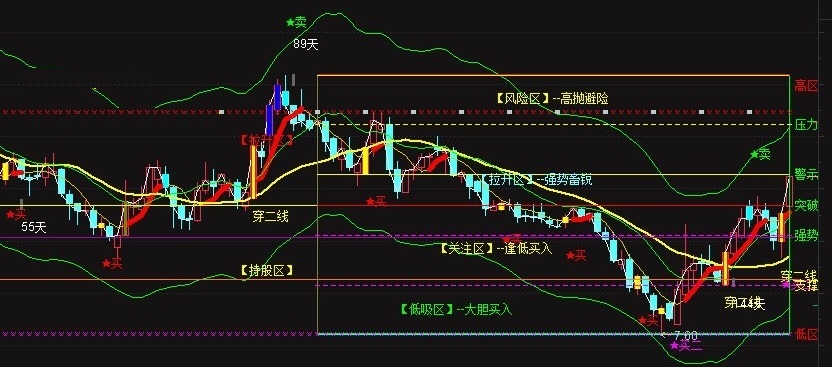
drawtext(currbarscount=n/4+8,gd-kj*0.09,'【风险区】--高抛避险'),color00ffff;
drawtext(currbarscount=n/4+10,gd-kj*0.4,'【拉升区】--强势畜锐'),colorffff80;
drawtext(currbarscount=n/4+15,dd+kj/3,'【关注区】--逢低买入'),color00ffff;
drawtext(currbarscount=n/4+20,dd+kj/10,'【低吸区】--大胆买入'),color00ff00;
drawtext(currbarscount=n/2+10,gd-kj*0.25,'【拉升区】'),colorred;
drawtext(currbarscount=n/2+10,dd+kj*0.25,'【持股区】'),coloryellow;
>>>使用本站搜索工具可以找到更多“自用指标MADX指标(主图 通达信 贴图)逢低关注区买进,高抛风险区避险下载”
指标公式下载地址
好公式网提供全网最全的指标公式软件,感谢您的支持!鼠标双击图片可看大图!下载请点击右侧“立即下载”,如只有源码,请点击本页面右侧的导入方法按图导入!
本站指标基于网友分享,仅供研究自学,勿作他用,本站对下载使用不承担任何责任!
相关通达信公式推荐
同花顺趋势逢低追涨副图指标 逢低买入追涨 源码 效果图
同花顺短底追击买入副图指标 短期底部反弹出手 源码 效果图
【智能强势抄底】副图指标,强势区间抄底,弱势区间逃顶,通达信 源码
连阳首阴缩量战法副图/选股指标 量价关系定量模型 通达信 源码
主力量学主图指标 量学二一阻力 为阻力位做标记 通达信 源码
仁者心动买卖分时副图指标 独创博弈动机分时T+0指标 通达信 源码
心想事成副图指标 精准预测分时买卖时机 通达信 源码
底部涨停买副图/选股指标 短中线超准买点 通达信 源码
筹码变化改版副图指标 埋伏在起涨前的公式 通达信 无未来 源码
预警信号幅图指标 第一次发指标 通达信 源码 不限时
龙头竞价分时指标 专做一进二集合竞价打板 好用的t0指标分享 通达信 源码
也发个迸凑的【迸凑一进二】竞价指标 回测3天 效果还不错 通达信 源码
【顶底趋势】自用主图公式 提前预知底部 下跌中股票提示变盘在即 等待突破后介入 源码
自用《资金博弈终结》副图指标 看透庄家 多头行情赚到吐 成功率90%以上 可验证
弘历鱼跃龙门副图/选股指标 弘历涨停模型 通达信 源码 无密
指标公式下载注意
☉ 好公式网发布的指标公式主要用于软件技术面分析,仅供参考,勿用于实际操作,据此操作风险自负!
☉ 解压密码:www.goodgongshi.com 就是好公式网域名,希望大家看清楚,切勿输错。
☉ tnc和tni格式指标公式,仅可以用通达信软件引入使用,例如可以用通达信软件引入使用指标公式;
☉ tne格式指标公式,仅可以用通达信软件公式编辑器5.0版导入,高版本兼容低版本;
☉ fnc格式指标公式,可以用大智慧软件新一代高速行情分析系统股票软件使用,少部分可以用分析家软件引入使用;
☉ alg格式指标公式,仅仅可以用飞狐交易师软件引入使用;exp格式指标公式,仅可以用大智慧经典版软件引入使用;
☉ hxf格式指标公式,仅可以用同花顺软件引入使用。
☉ 如果您发现下载软件链接错误,请联系管理员报告错误。
☉ 好公式网欢迎各位网友帮忙宣传转发本站网址,有您的支持,我们会做得更好!
☉ 本文自用指标MADX指标(主图 通达信 贴图)逢低关注区买进,高抛风险区避险下载仅供学习研究。
 粤公网安备 44010602010581号