您的位置:好公式网 → 通达信公式 → 通达信天线中线地线通道主图附测试图指标下载
通达信天线中线地线通道主图附测试图指标下载
- 指标公式类型:通达信公式
- 公式推荐星级:

- 指标公式安全:已通过5款杀毒软件查杀,请放心下载!
- 公式更新时间:2019-12-01 09:22:49
- 指标公式标签:
- 公式运行环境: WinXP/Win7/Win8/Win10/Win All
- 指标公式语言:用简体中文编写
指标公式详细说明
好公式网(www.goodgongshi.com)告诉您:当前正要下载:通达信天线中线地线通道主图附测试图指标下载
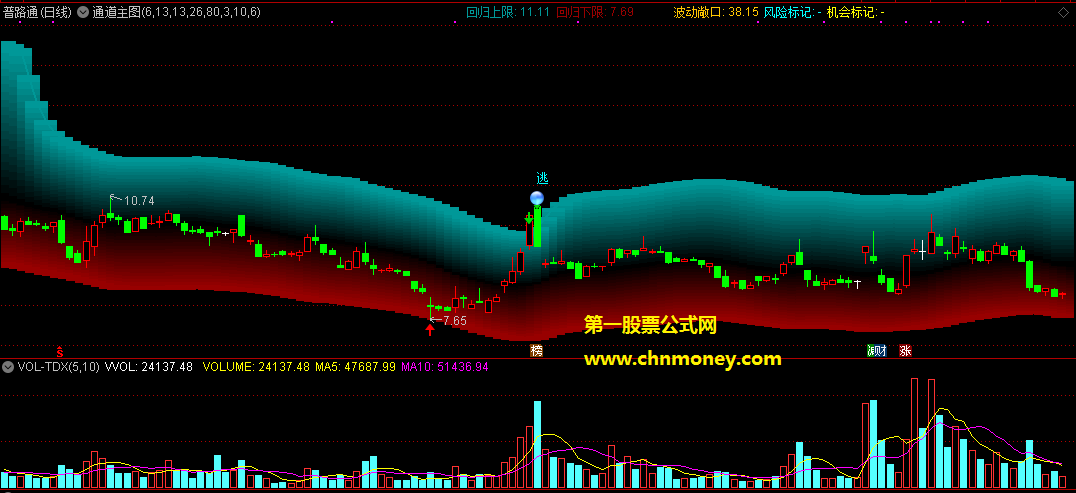
通达信天线中线地线通道主图附测试图指标
mid_tdms:=(3*c+l+h)/5;
波动中枢:=ema(ema(ema(mid_tdms,20),2),2),pointdot;
bdup:=ref(hhv(100*(high-波动中枢)/波动中枢,120),1),nodraw;
bddn:=ref(llv(100*(low-波动中枢)/波动中枢,120),1),nodraw;
顶:=ema(ema(ema(ref(波动中枢,1)*(1+bdup/100),2),2),2);
底:=ema(ema(ema(ref(波动中枢,1)*(1+bddn/100),2),2),2);
地线:=底;
中线:=ref(波动中枢,1);
天线:=顶;
绘图范围:=iff(barscount(close)>120,1,0);
stickline(绘图范围,地线,地线+(中线-地线)*(20/20),11,0),color000000;
stickline(绘图范围,地线,地线+(中线-地线)*(19/20),11,0),color000008;
stickline(绘图范围,地线,地线+(中线-地线)*(18/20),11,0),color000010;
stickline(绘图范围,地线,地线+(中线-地线)*(17/20),11,0),color000018;
stickline(绘图范围,地线,地线+(中线-地线)*(16/20),11,0),color000020;
stickline(绘图范围,地线,地线+(中线-地线)*(15/20),11,0),color000028;
stickline(绘图范围,地线,地线+(中线-地线)*(14/20),11,0),color000030;
stickline(绘图范围,地线,地线+(中线-地线)*(13/20),11,0),color000038;
stickline(绘图范围,地线,地线+(中线-地线)*(12/20),11,0),color000040;
stickline(绘图范围,地线,地线+(中线-地线)*(11/20),11,0),color000048;
stickline(绘图范围,地线,地线+(中线-地线)*(10/20),11,0),color000050;
stickline(绘图范围,地线,地线+(中线-地线)*(9/20),11,0),color000058;
stickline(绘图范围,地线,地线+(中线-地线)*(8/20),11,0),color000060;
stickline(绘图范围,地线,地线+(中线-地线)*(7/20),11,0),color000068;
stickline(绘图范围,地线,地线+(中线-地线)*(6/20),11,0),color000070;
stickline(绘图范围,地线,地线+(中线-地线)*(5/20),11,0),color000078;
stickline(绘图范围,地线,地线+(中线-地线)*(4/20),11,0),color000080;
stickline(绘图范围,地线,地线+(中线-地线)*(3/20),11,0),color000088;
stickline(绘图范围,地线,地线+(中线-地线)*(2/20),11,0),color000090;
stickline(绘图范围,地线,地线+(中线-地线)*(1/20),11,0),color000098;
stickline(绘图范围,天线,天线-(天线-中线)*(20/20),11,0),color000000;
stickline(绘图范围,天线,天线-(天线-中线)*(19/20),11,0),color080800;
stickline(绘图范围,天线,天线-(天线-中线)*(18/20),11,0),color101000;
stickline(绘图范围,天线,天线-(天线-中线)*(17/20),11,0),color181800;
stickline(绘图范围,天线,天线-(天线-中线)*(16/20),11,0),color202000;
stickline(绘图范围,天线,天线-(天线-中线)*(15/20),11,0),color282800;
stickline(绘图范围,天线,天线-(天线-中线)*(14/20),11,0),color303000;
stickline(绘图范围,天线,天线-(天线-中线)*(13/20),11,0),color383800;
stickline(绘图范围,天线,天线-(天线-中线)*(12/20),11,0),color404000;
stickline(绘图范围,天线,天线-(天线-中线)*(11/20),11,0),color484800;
stickline(绘图范围,天线,天线-(天线-中线)*(10/20),11,0),color505000;
stickline(绘图范围,天线,天线-(天线-中线)*(9/20),11,0),color585800;
stickline(绘图范围,天线,天线-(天线-中线)*(8/20),11,0),color606000;
stickline(绘图范围,天线,天线-(天线-中线)*(7/20),11,0),color686800;
stickline(绘图范围,天线,天线-(天线-中线)*(6/20),11,0),color707000;
stickline(绘图范围,天线,天线-(天线-中线)*(5/20),11,0),color787800;
stickline(绘图范围,天线,天线-(天线-中线)*(4/20),11,0),color808000;
stickline(绘图范围,天线,天线-(天线-中线)*(3/20),11,0),color888800;
stickline(绘图范围,天线,天线-(天线-中线)*(2/20),11,0),color909000;
stickline(绘图范围,天线,天线-(天线-中线)*(1/20),11,0),color989800;
回归上限:iff(绘图范围,天线,drawnull),color989800,linethick2;
回归下限:iff(绘图范围,地线,drawnull),color000098,linethick2;
上涨偏离度:=100*(high-波动中枢)/波动中枢,nodraw;
下跌偏离度:=100*(low-波动中枢)/波动中枢,nodraw;
stickline(绘图范围 and close>open,high,close,0,0),colorred;
stickline(绘图范围 and close>open,low,open,0,0),colorred;
stickline(绘图范围 and close>open,close,open,3,1),colorred;
stickline(绘图范围 and close==open,high,low,0,0),colorwhite;
stickline(绘图范围 and close==open,close,open,3,0),colorwhite;
stickline(绘图范围 and close<open,high,low,0,0),colorgreen;
stickline(绘图范围 and close<open,close,open,3,0),colorgreen;
波动敞口:((回归上限-波动中枢)/波动中枢+(波动中枢-回归下限)/波动中枢)*100,nodraw,color00c6ff;
涨过头:=iff(high>回归上限,1,0);{好公式网-最好的股票公式网站 www.goodgongshi.com}
跌过头:=iff(low<回归下限,1,0);
风险标记:iff(涨过头,close,drawnull),nodraw,colorcyan;
机会标记:iff(跌过头,close,drawnull),nodraw,coloryellow;
drawicon(涨过头,high*1.01,2);
drawicon(跌过头,low*0.99,1);
varc:=sma(max(close-ref(close,1),0),6,1)/sma(abs(close-ref(close,1)),6,1)*100;
逃顶:=iff(cross(84,varc) and 上涨偏离度>20,1,0),nodraw;
var1:=(high+low+open+2*close)/5;
var2:=ref(var1,1);{www.goodgongshi.com}
var3:=sma(max(var1-var2,0),10,1)/sma(abs(var1-var2),10,1)*100;
var4:=filter(iff(count(var3<20,5)>=1 and count(var1==llv(var1,10),10)>=1 and close>=open*1.038 and vol>ma(vol,5)*1.2,1,0),5);
抄底:=iff(var4 and exist(下跌偏离度*(-1)>15,3),1,0);
drawicon(绘图范围 and 逃顶,high*1.02,14);
drawicon(绘图范围 and 抄底,low*0.98,13);
drawtext(绘图范围 and 逃顶,max(h*1.05,回归上限*1.03),'逃'),colorcyan;
drawtext(绘图范围 and 抄底,min(low*0.995,回归下限),'抄'),coloryellow;
>>>使用本站搜索工具可以找到更多“通达信天线中线地线通道主图附测试图指标下载”
指标公式下载地址
好公式网提供全网最全的指标公式软件,感谢您的支持!鼠标双击图片可看大图!下载请点击右侧“立即下载”,如只有源码,请点击本页面右侧的导入方法按图导入!
本站指标基于网友分享,仅供研究自学,勿作他用,本站对下载使用不承担任何责任!
上一指标公式:跟庄到顶主图无未来附测试贴图暂且未加密指标下载
下一指标公式:日线主图基本面公式下载
相关通达信公式推荐
【智能强势抄底】副图指标,强势区间抄底,弱势区间逃顶,通达信 源码
连阳首阴缩量战法副图/选股指标 量价关系定量模型 通达信 源码
主力量学主图指标 量学二一阻力 为阻力位做标记 通达信 源码
仁者心动买卖分时副图指标 独创博弈动机分时T+0指标 通达信 源码
心想事成副图指标 精准预测分时买卖时机 通达信 源码
底部涨停买副图/选股指标 短中线超准买点 通达信 源码
筹码变化改版副图指标 埋伏在起涨前的公式 通达信 无未来 源码
预警信号幅图指标 第一次发指标 通达信 源码 不限时
龙头竞价分时指标 专做一进二集合竞价打板 好用的t0指标分享 通达信 源码
也发个迸凑的【迸凑一进二】竞价指标 回测3天 效果还不错 通达信 源码
弘历鱼跃龙门副图/选股指标 弘历涨停模型 通达信 源码 无密
VOL去弱留强副图/选股指标 看量能行事 通达信 源码
通达信【自用竞价】竞价排序指标/副图/选股公式 9点25分后出票 全天不变 源码
EXPMA均线5号主图指标 有用法说明 通达信 源码
小强竞价竞量副图/选股指标 自动选取最强爆发股 通达信 源码
指标公式下载注意
☉ 好公式网发布的指标公式主要用于软件技术面分析,仅供参考,勿用于实际操作,据此操作风险自负!
☉ 解压密码:www.goodgongshi.com 就是好公式网域名,希望大家看清楚,切勿输错。
☉ tnc和tni格式指标公式,仅可以用通达信软件引入使用,例如可以用通达信软件引入使用指标公式;
☉ tne格式指标公式,仅可以用通达信软件公式编辑器5.0版导入,高版本兼容低版本;
☉ fnc格式指标公式,可以用大智慧软件新一代高速行情分析系统股票软件使用,少部分可以用分析家软件引入使用;
☉ alg格式指标公式,仅仅可以用飞狐交易师软件引入使用;exp格式指标公式,仅可以用大智慧经典版软件引入使用;
☉ hxf格式指标公式,仅可以用同花顺软件引入使用。
☉ 如果您发现下载软件链接错误,请联系管理员报告错误。
☉ 好公式网欢迎各位网友帮忙宣传转发本站网址,有您的支持,我们会做得更好!
☉ 本文通达信天线中线地线通道主图附测试图指标下载仅供学习研究。
 粤公网安备 44010602010581号