您的位置:好公式网 → 通达信公式 → 资金趋势公式下载 通达信趋势
资金趋势公式下载 通达信趋势

指标公式详细说明
好公式网(www.goodgongshi.com)告诉您:当前正要下载:资金趋势公式下载 通达信趋势
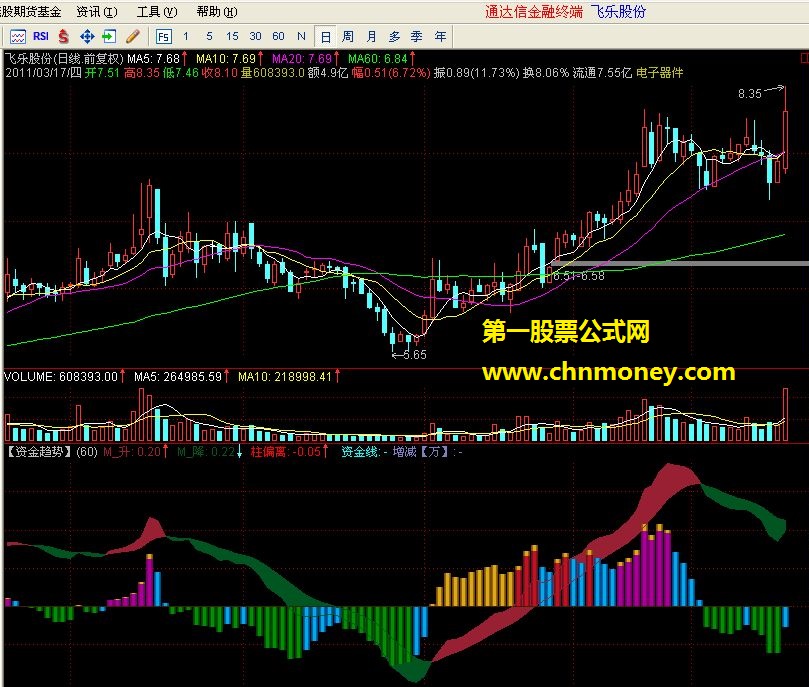
资金趋势
{--【资金趋势】指标由【supl资金线】+【短线掘金】+【macd】指标精准优化整合--}
{--------k线个数:最小 30 最大 240 默认 80 (默认值为主图显示k线个数)--------}
short:=12;long:=26;mid:=9;
m_升:ema(close,short)-ema(close,long),color332099;
m_降:ema(m_升,mid),color205500;
柱偏离:(m_升-m_降)*2,colorstick,color0000ff;
macd红绿趋势:drawband(m_升,rgb(153,32,51),m_降,rgb(0,85,32));
dif高点:=if(m_升>m_降,m_升,m_降);
dif低点:=if(m_升<m_降,m_升,m_降);
macd高点:=if(柱偏离>dif高点,柱偏离,dif高点);
macd低点:=if(柱偏离<dif低点,柱偏离,dif低点);
macd高点定位:=if(period=0,const(hhv(macd高点,barssince(c))),const(hhv(macd高点,k线个数)));
macd低点定位:=if(period=0,const(llv(macd低点,barssince(c))),const(llv(macd低点,k线个数)));
顶:=const(hhv(max(macd高点定位,macd低点定位),k线个数));
底:=const(llv(min(macd高点定位,macd低点定位),k线个数));
{-【主力动向】,即原【supl】往事如风-qq:105365158 经海量数据分析及精准校验--};
tmp:=largeintrdvol-largeouttrdvol;
ddy动因:=if(tradenum>0,(tradeoutnum-tradeinnum)*100/tradenum,0);
涨跌动因:=if(ddy动因>0 or ddy动因<0 or tmp>0 or tmp<0,ddy动因,drawnull),nodraw;
supl资金线:=sum((largeintrdvol-largeouttrdvol)*10000/finance(7),0);
主力资金线:=if(currbarscount<=k线个数,if(ref(supl资金线,1)=drawnull,drawnull,supl资金线),drawnull);
资金线统计周期:=barscount(主力资金线);
资金线hh:=const(hhv(主力资金线,资金线统计周期));
资金线ll:=const(llv(主力资金线,资金线统计周期));
资金线:if(涨跌动因=drawnull,drawnull,(主力资金线-llv(资金线ll,资金线统计周期))/(hhv(资金线hh,资金线统计周期)-llv(资金线ll,资金线统计周期))*(顶-底)+底),colorffff00;
{资金净流}
增减【万】:if(涨跌动因=drawnull,drawnull,if(finance(7)=drawnull,drawnull,(largeintrdvol-largeouttrdvol)*amo/v/10000)),colorc08080,nodraw;
⑤日:=if(涨跌动因=drawnull,drawnull,if(ma(资金线,5)=drawnull,ema(资金线,5),ma(资金线,5))),color800080,nodraw;
趋势:=if(涨跌动因=drawnull,drawnull,if(ma(资金线,10)=drawnull,ema(资金线,10),ma(资金线,10))),color008080,nodraw;
{-对【短线掘金】指标进行修改,并为macd红绿柱配上不同的颜色,使更便于观察判断-}
量能:=ma((vol-ref(vol,1))/ref(vol,1),10);
大盘趋势:=(close-ma(close,22))/ma(close,22);
个股趋势:=(close-ma(close,22))/ma(close,22);
股价趋势:=if(hsl=drawnull,大盘趋势,个股趋势);
原净买量a:=(股价趋势*(1+量能))-ma((股价趋势*(1+量能)),8),color00ddff;
原净买量:=if(原净买量a=drawnull,柱偏离,原净买量a);
动量:=if((原净买量+柱偏离)<-柱偏离*1.1 and 原净买量<0,柱偏离*0.1,if((原净买量+柱偏离)>柱偏离*1.1 and 原净买量>0,柱偏离*0.1,原净买量)),color00b0b0;
上涨:=原净买量>0 and 柱偏离>0;反弹:=原净买量>0 and 柱偏离<0;
调整:=原净买量<0 and 柱偏离>0;下跌:=原净买量<0 and 柱偏离<0;
净买量流向a:=if(上涨,动量+柱偏离,if(反弹,柱偏离-动量,if(调整,柱偏离-动量,动量+柱偏离)));
净量:=if(净买量流向a=drawnull,柱偏离,净买量流向a),color00ccff,nodraw;
{macd兰柱}
stickline(柱偏离<0,0,柱偏离,2.3,0),color884400;
stickline(柱偏离<0,0,柱偏离,1.7,0),coloraa6600;
stickline(柱偏离<0,0,柱偏离,1.0,0),colorcc8800;
stickline(柱偏离<0,0,柱偏离,0.33,0),coloreeaa00;
{macd量价配合}
量价配合:=原净买量>0 and 柱偏离>0;
stickline(量价配合,0,净量,2.3,0),color104a7a;
stickline(量价配合,0,净量,1.7,0),color106699;
stickline(量价配合,0,净量,1.0,0),color1088bb;
stickline(量价配合,0,净量,0.33,0),color10aadd;
{macd量价背离}
量价背离:=原净买量<=0 and 柱偏离>0;
stickline(量价背离 or 柱偏离<0,0,柱偏离,2.3,0),color8a4a00;
stickline(量价背离 or 柱偏离<0,0,柱偏离,1.7,0),coloraa6600;
stickline(量价背离 or 柱偏离<0,0,柱偏离,1.0,0),colorcc8800;
stickline(量价背离 or 柱偏离<0,0,柱偏离,0.33,0),coloreeaa00;
{macd量价齐跌}
量价齐跌:=原净买量<=0 and 柱偏离<0;
stickline(量价齐跌,0,柱偏离,2.3,0),color004400;
stickline(量价齐跌,0,柱偏离,1.7,0),color005a00;
stickline(量价齐跌,0,柱偏离,1.0,0),color007700;
stickline(量价齐跌,0,柱偏离,0.33,0),color009000;
{macd持续上涨}
持续上涨:=原净买量>=0 and 柱偏离>=0 and m_升>0;
stickline(持续上涨,0,柱偏离,2.3,0),color660077;
stickline(持续上涨,0,柱偏离,1.7,0),color770088;
stickline(持续上涨,0,柱偏离,1.0,0),color880099;
stickline(持续上涨,0,柱偏离,0.33,0),color9900aa;
{macd上涨趋势}
量价齐升:=原净买量>=0 and 柱偏离>=0 and m_升>0 and 柱偏离>=m_降;
stickline(量价齐升,0,柱偏离,2.3,0),color201066;
stickline(量价齐升,0,柱偏离,1.7,0),color201088;
stickline(量价齐升,0,柱偏离,1.0,0),color2010aa;
stickline(量价齐升,0,柱偏离,0.33,0)color2010c5;
{零轴线}
stickline(1,0,0,6,0),color002040;
{drawicon(cross(⑤日,趋势) and ⑤日>ref(⑤日,1),⑤日,13);
drawicon(cross(资金线,⑤日) and cross(资金线,趋势),⑤日,13);
drawicon(cross(趋势,资金线),⑤日,14);
drawicon(cross(⑤日,资金线) and cross(趋势,资金线),⑤日,14);}
{----对【macd】指标趋势及【supl资金线】指标线形立体描边,以增强视觉效果----}
上升时dif:=if(period!=0 and m_升>m_降,m_升,drawnull),color332099;
上升时dea:=if(period!=0 and m_升>m_降,m_降,drawnull),color332099;
下降时dif:=if(period!=0 and m_升<m_降,m_升,drawnull),color205500;
下降时dea:=if(period!=0 and m_升<m_降,m_降,drawnull),color205500;
上升时dif补画:drawband(上升时dif,rgb(153,32,51),上升时dif,rgb(153,32,51));
上升时dea补画:drawband(上升时dea,rgb(153,32,51),上升时dea,rgb(153,32,51));
下降时dif补画:drawband(下降时dif,rgb(0,85,32),下降时dif,rgb(0,85,32));
下降时dea补画:drawband(下降时dea,rgb(0,85,32),下降时dea,rgb(0,85,32));
{-资金趋势指标,往事如风原创,qq:105365158,决策信号存于如风服务器,破解无效!-}
短期:=100*(c-llv(l,5))/(hhv(c,5)-llv(l,5));
中期:=100*(c-llv(l,10))/(hhv(c,10)-llv(l,10));
中长期:=100*(c-llv(l,20))/(hhv(c,20)-llv(l,20));
长期:=100*(c-llv(l,30))/(hhv(c,30)-llv(l,30));
短线:=ma(c,3)>ref(ma(c,3),1) and ref(ma(c,3),1)<ref(ma(c,3),2);
生命线:=ma(forcast(ma(c,1)/ma(ref(c,18),18)*100,20),6);
真伪:=短线 and 长期>=80 and 长期>中长期 and 长期>中期 and 长期>短期 and 生命线>ref(生命线,1);
drawtext(真伪,m_降,11),color0080ff;
a1:=barslast(ref(cross(m_升,m_降),1));
底背离:=ref(close,a1+1)>close and m_升>ref(m_升,a1+1) and cross(m_升,m_降);
a2:=barslast(ref(cross(m_降,m_升),1));
顶背离:=ref(close,a2+1)<close and ref(m_升,a2+1)>m_升 and cross(m_降,m_升);
低位金叉:=cross(m_升,m_降) and m_升<-0.1;
jccount:=count(cross(m_升,m_降),barslast(m_降>=0));
二次金叉:=cross(m_升,m_降) and m_降<0 and count(jccount=2,21)=1;
drawicon(低位金叉 and 二次金叉 and 底背离,m_降,1);
drawtext(顶背离,m_降,12),colorffffff;
drawtext(底背离,m_降,13),colorff0080;
drawtext(二次金叉,m_升,14),coloryellow;
{资金线,强势区}
⑤日dif分时互换:=if(period=0,m_升,⑤日),color332099;
趋势dea分时互换:=if(period=0,m_降,趋势),color332099;
drawband(资金线,rgb(0,255,255),资金线,rgb(0,255,255));
drawband(⑤日dif分时互换,rgb(102,16,102),⑤日dif分时互换,rgb(128,128,0));
drawband(趋势dea分时互换,rgb(128,128,0),趋势dea分时互换,rgb(128,128,0));
{主力买卖点}
主力买:=(largeintrdvol)*10000/finance(7);
主力买hh:=const(hhv(主力买,资金线统计周期));
主力买ll:=const(llv(主力买,资金线统计周期));
主力买入:=(主力买-llv(主力买ll,资金线统计周期))/(hhv(主力买hh,资金线统计周期)-llv(主力买ll,资金线统计周期))*(顶-底)-底;
主力卖:=(largeouttrdvol)*10000/finance(7);
主力卖hh:=const(hhv(主力卖,资金线统计周期));
主力卖ll:=const(llv(主力卖,资金线统计周期));
主力卖出:=(主力卖-llv(主力卖ll,资金线统计周期))/(hhv(主力卖hh,资金线统计周期)-llv(主力卖ll,资金线统计周期))*(顶-底)+底;
主力买入线:=if(finance(61)>0.01,资金线+主力买入/1350,资金线+主力买入/50);
主力卖出线:=if(finance(61)>0.01,资金线+主力卖出/1350,资金线+主力卖出/50);
stickline(1,主力买入线,资金线,0.005,0),color8000ff;
stickline(1,主力卖出线,资金线,0.005,0),color00ff00;
日线以下周期:=period=0 or period=1 or period=2 or period=3 or period=4 or period=8;
drawtext(currbarscount=1 and 涨跌动因=drawnull and 日线以下周期=0 and finance(7)!=drawnull,0,15),colorc0c0c0;
drawtext(currbarscount=1 and 涨跌动因=drawnull and 日线以下周期=0 and finance(7)!=drawnull,(底-0)/3,16),colorc0c0c0;
drawtext(currbarscount=1 and 涨跌动因!=drawnull,(底-0)/4,17),colorff8000;
>>>使用本站搜索工具可以找到更多“资金趋势公式下载 通达信趋势”
指标公式下载地址
好公式网提供全网最全的指标公式软件,感谢您的支持!鼠标双击图片可看大图!下载请点击右侧“立即下载”,如只有源码,请点击本页面右侧的导入方法按图导入!
本站指标基于网友分享,仅供研究自学,勿作他用,本站对下载使用不承担任何责任!
上一指标公式:日出股海-追踪主力公式下载 通达信日出主力
下一指标公式:盘古开天公式下载 通达信盘古
相关通达信公式推荐
同花顺趋势逢低追涨副图指标 逢低买入追涨 源码 效果图
在实际炒股总结出来寻找强势黑马的强攻优选助涨副图公式
筹码变化改版副图指标 埋伏在起涨前的公式 通达信 无未来 源码
【顶底趋势】自用主图公式 提前预知底部 下跌中股票提示变盘在即 等待突破后介入 源码
自用《资金博弈终结》副图指标 看透庄家 多头行情赚到吐 成功率90%以上 可验证
同花顺资金牛股买入点副图指标 金牛线下出橙色柱可关注 源码 效果图
同花顺渔家快捞鱼副图指标 一条趋势线看进出 源码 效果图
根据经典成交量缩减形态来推测走势的无敌缩量拉升副图公式
通达信【自用竞价】竞价排序指标/副图/选股公式 9点25分后出票 全天不变 源码
趋势上涨副图/选股指标 盈利小利器 通达信 源码
乾坤大三浪选股公式,道氏理论+洛氏霍克+竞价量能,盘中预警,稳稳复利,源码
配合红线在上买绿线在上卖规则使用的趁势上翘金叉副图公式
最近网上很火的《极品人气解码》副图指标,标新立异,看趋势挺好!
应大家的要求发布《竞价一进二》指标,连续抓涨停的竞价选股公式,大神请绕道
三节妖小趋势副图指标 好看又好用 源码 加密已解密
指标公式下载注意
☉ 好公式网发布的指标公式主要用于软件技术面分析,仅供参考,勿用于实际操作,据此操作风险自负!
☉ 解压密码:www.goodgongshi.com 就是好公式网域名,希望大家看清楚,切勿输错。
☉ tnc和tni格式指标公式,仅可以用通达信软件引入使用,例如可以用通达信软件引入使用指标公式;
☉ tne格式指标公式,仅可以用通达信软件公式编辑器5.0版导入,高版本兼容低版本;
☉ fnc格式指标公式,可以用大智慧软件新一代高速行情分析系统股票软件使用,少部分可以用分析家软件引入使用;
☉ alg格式指标公式,仅仅可以用飞狐交易师软件引入使用;exp格式指标公式,仅可以用大智慧经典版软件引入使用;
☉ hxf格式指标公式,仅可以用同花顺软件引入使用。
☉ 如果您发现下载软件链接错误,请联系管理员报告错误。
☉ 好公式网欢迎各位网友帮忙宣传转发本站网址,有您的支持,我们会做得更好!
☉ 本文资金趋势公式下载 通达信趋势仅供学习研究。
 粤公网安备 44010602010581号