您的位置:好公式网 → 大智慧公式 → 子秦自用第二季-之多功能版全能主图公式下载 大智慧指标第二季
子秦自用第二季-之多功能版全能主图公式下载 大智慧指标第二季
- 指标公式类型:大智慧公式
- 公式推荐星级:

- 指标公式安全:已通过5款杀毒软件查杀,请放心下载!
- 公式更新时间:2018-08-05 21:05:00
- 指标公式标签:
- 公式运行环境: WinXP/Win7/Win8/Win10/Win All
- 指标公式语言:用简体中文编写
指标公式详细说明
好公式网(www.goodgongshi.com)告诉您:当前正要下载:子秦自用第二季-之多功能版全能主图公式下载 大智慧指标第二季
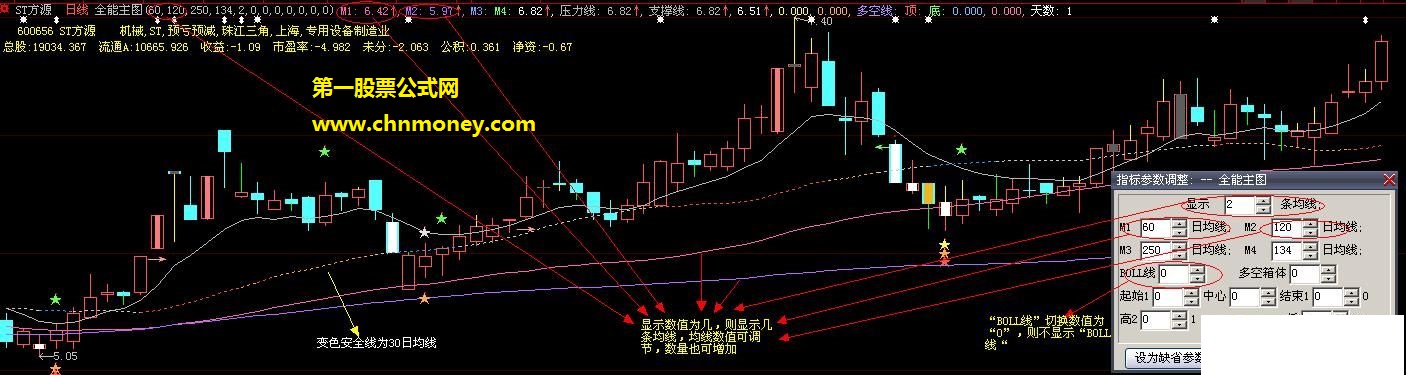
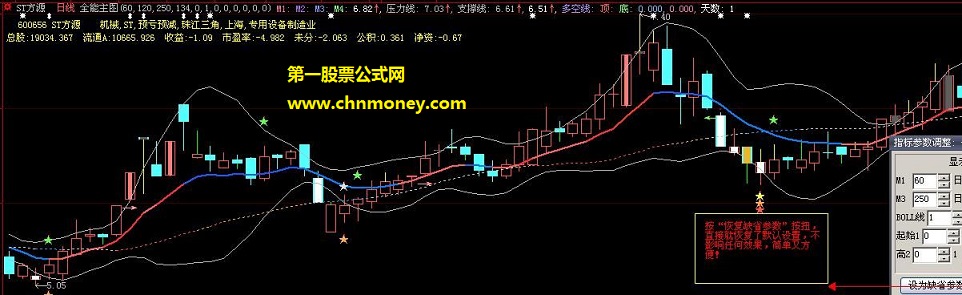
子秦自用第二季-之多功能版全能主图
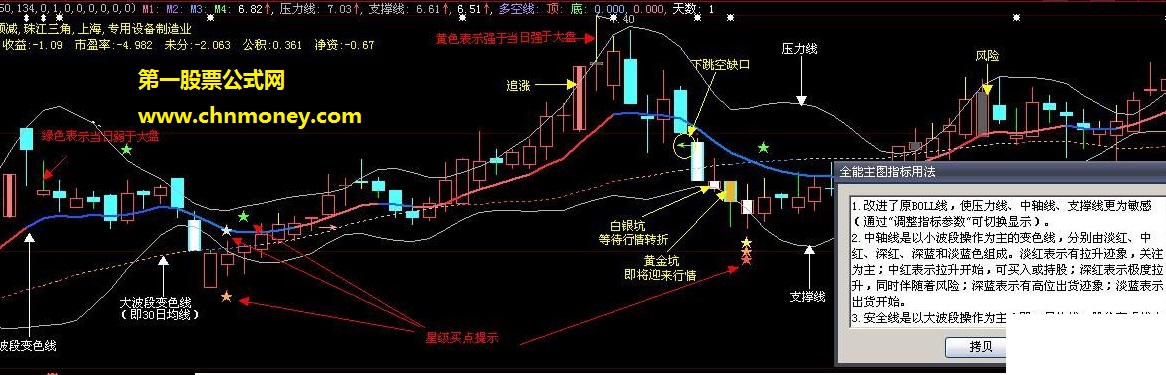
大家一起分享的是“子秦自用指标第二季”——多功能版“全能主图”,可能也是最后一季了,希望能给股友们带来些许帮助。这个主图是我用
一年时间来修补和加工而成,集合了20个大小指标吧。几个大指标为“优化布林线”、“仿飞狐均线系统”、“多空概率”、“半自动画线”和“星级买点”(星级买点是我
用7、8个指标精炼出来的买点提示,用6色五角星来细化买点的等级,用5天盈利3%的大智慧系统测试结果为:2009年1月1日-2009年12月31日成功率是80%以上,2010年1月1日
到现在,成功率是70%左右,故只能作为参考)。这个主图指标的最大特色个人认为比较全面,几个主要指标都可自由切换而不影响整体的显示,各提示图标和指标线的色彩我
也重点加工过,使整体画面简洁明了、较有协调感,长时间看也不会让人眼花。由于源码过大,我就不贴了,直接发送源码文件(如果系统跑的慢的朋友可选择“布林线b”进
行下载,那是简化后的,不过只有关键的“优化布林线”和“星级买点”,没有切换功能),关于指标用法和说明,我将通过下面的贴图来简单介绍,具体可参考指标里做好
的“指标用法注解”。最后再次感谢那些编写、提供源码的老师们,希望朋友们能再多多完善这个指标,上传上来供大家分享!
注:指标里只有财务信息和半自动画线用到所谓的未来函数,其他均无任何影响,请放心使用!另我上传的源码文件绝不设置密码、时间限制等!
全能主图
{参数自己设置一下}
{大智慧仿飞狐ma均线指标-------可以调节均线条数}
wx:=varp( 10, 0);
m1:ma(close,p1)*if(n<1,wx,1),precis2,coloraf61fe;
m2:ma(close,p2)*if(n<2,wx,1),precis2,colorff6ab1;
m3:ma(close,p3)*if(n<3,wx,1),precis2,colorff9f80;
m4:ma(close,p4)*if(n<4,wx,1),precis2,color6fff6f;
{财务信息}
zg:=finance2(35);{总股}
lta:=finance2(37);{流通a}
sy:=finance2(3);{收益}
sl:=dynainfo(39);{市盈率}
wf:=finance2(8);{未分}
gj:=finance2(7);{公积};
jz:=finance2(4);{净资}
cw:='总股:'+zg+' 流通a:'+lta+' 收益:'+sy+' 市盈率:'+sl+' 未分:'+wf+' 公积:'+gj+' 净资:'+jz;
drawtextabs(5,24,cw),coloryellow;
drawtextabs(20,8,stklabel+' '+stkname+' '+bkname),coloryellow;
{大盘对比}
大盘涨跌:=(indexc/ref(indexc,1)-1)*100;
个股涨跌:=(c/ref(c,1)-1)*100;
stickline(大盘涨跌<=0 and 个股涨跌>0 and c>o and c<h,h,c,0.1,0),layer3,coloryellow;
stickline(大盘涨跌<=0 and 个股涨跌>0 and c>o and c=h,c,c,6,0),layer3,coloryellow;
stickline(大盘涨跌<=0 and 个股涨跌>0 and c<o and c>l,l,c,0.1,0),layer3,coloryellow;
stickline(大盘涨跌<=0 and 个股涨跌>0 and c<o and c=l,c,c,6,0),layer3,coloryellow;
stickline(大盘涨跌>0 and 个股涨跌<=0 and c<o and c>l,l,c,0.1,0),layer3,colorgreen;
stickline(大盘涨跌>0 and 个股涨跌<=0 and c<o and c=l,c,c,6,0),layer3,colorgreen;
stickline(大盘涨跌>0 and 个股涨跌<=0 and c>o and c<h,h,c,0.1,0),layer3,colorgreen;
stickline(大盘涨跌>0 and 个股涨跌<=0 and c>o and c=h,c,c,6,0),layer3,colorgreen;
{布林线-可切换显示}
bbi:="bbi"(3,6,12,24);
bi:=ma(close,20);
bi1:=100*(close-bi)/std(close,20)*boll线;
bi2:=ema(bi1,10)*boll线;
中轴线:=(ma(close,3)+ma(close,6)+ma(close,12)+ma(close,24))/4;
partline(中轴线,bi1>bi2 and bi1<-100,rgb(255,172,172),bi1>bi2 and bi1>=-100 and bi1<=170,rgb(255,95,95),bi1>bi2 and bi1>=170,rgb(255,47,47),bi1<bi2 and bi1>0,rgb(30,86,255),bi1<bi2 and bi1<=0,rgb(2,129,255)),precis2,linethick2,layer2,colorwhite;
压力线:if(bbi+3*std(bbi,10)*boll线>0,bbi+3*std(bbi,10)*boll线,0),precis2,layer2,colorb7b7b7;
支撑线:if(bbi-3*std(bbi,10)*boll线>0,bbi-3*std(bbi,10)*boll线,0),precis2,layer2,colorb7b7b7;
安全线:=ma(close,30);
{神奇主图}
操作:=ma((low+high+close)/3,5);
拉升:=hhv(操作,13);
庄压:=hhv(ma(h,13),13);
支撑:=llv(操作,13);
partline(安全线,操作=拉升 and 拉升>ref(拉升,1) and 庄压>ref(庄压,1),rgb(255,70,70),操作=支撑,rgb(47,151,255),庄压>ref(庄压,1),rgb(255,163,75),庄压<=ref(庄压,1),rgb(202,202,202),操作<ref(操作,1) and 庄压=ref(庄压,1) and 拉升=ref(庄压,1),rgb(30,86,255)),precis2,layer2,dotline,colorwhite;
{神偷富贵}
v1:=(close-ma(close,13))/ma(close,13)*300;
varqs3:=ma(v1,17)+ma(v1,17)-ref(ma(v1,17),1);
varqs4:=if(ma(v1,10)<varqs3,varqs3,ma(v1,10));
行情转折平衡线:=varqs4-(ema(v1,3)-varqs4)*1.02;
v2:=(close-llv(low,9))/(hhv(high,9)-llv(low,9))*100;
vara:=ref(low,1);
varb:=(sma(abs(low-vara),3,1))/(sma(max(low-vara,0),3,1))*100;
varc:=ema(if(close*1.3,varb*10,varb/10),3);
vard:=llv(low,13);
vare:=hhv(varc,13);
varf:=if(ma(close,34),1,0);
varg:=(ema(if(low<=vard,(varc+vare*2)/2,0),3))/(618)*varf;
{买点提示}
快:=count(close>ref(close,2),4)/4*100;
慢:=count(close>ref(close,2),6)/6*100;
var1:=llv(low,5);
var2:=hhv(high,5);
快线:= ema((close-var1)/(var2-var1)*100,4) ;
慢线:= ema(0.667*ref(快线,1)+0.333*快线,2);
jc:=(cross(快,1) and 慢<=40) or (cross(慢,20) and 快<=50);
rsv:=(close-llv(low,9))/(hhv(high,3)-llv(low,3))*100;
k:=sma(rsv,3,1);
d:=sma(k,3,1);
j:=3*k-2*d;
快进:=cross(快线,慢线) and 快线<30;
买1:=快=0 and 慢>20 and cross(v1,ref(v1,1));
买2:=快=0 and 慢>20 and cross(ref(行情转折平衡线,1),行情转折平衡线);
买3:=快进 and varg>15;
买4:=快进 and cross(varg<ref(varg,1),0.5);
买5:=快进 and 行情转折平衡线<ref(行情转折平衡线,1) and ref(行情转折平衡线,1)>=30;
关注1:=快=0 and 慢=0;
关注2:=v2<=3 or v2<=varg;
stickline(关注1 or 关注2,close,open,5,0),colorwhite;
一星买点:=买1 or 买2;
二星买点:=快=0 and between(慢,1,20) and cross(v1,ref(v1,1)) and cross(ref(行情转折平衡线,1),行情转折平衡线);
三星买点:=filter(jc,3);
四星买点:=买3 or 买4 or 买5;
五星买点:=ref(j,1)<0 and j>0;
六星买点:=cross(快线,慢线) and 慢线<40 and ref(j,1)<0 and j>0;
{图标提示}
drawtext(一星买点,h*1.02,'★'),colore1e1e1,align1;
drawtext(二星买点,h*1.03,'★'),colordbff4a,align1;
drawtext(三星买点,h*1.04,'★'),color4aff61,align1;
drawtext(四星买点,l*0.99,'★'),color4afffb,align1;
drawtext(五星买点,l*0.98,'★'),color4aa9ff,align1;
drawtext(六星买点,l*0.97,'★'),color4a58ff,align1;
{正反弦}
vaa1:=barscount(close)*3.142/60;
a2:=sin(vaa1*8)*100;
a3:=cos(vaa1*8)*100;
{极限}
极点:=a2>98 or a2<-99 or a3>98 or a3<-99;
stickline( 快线>77 and 极点,close,open,5,0),color5d5d5d;
关注3:=cross(count(关注1,6)=6,0.8);
进仓:=快线<20 and 极点;
stickline(关注3 or 进仓,close,open,5,0),color1fb6ef;
{追涨}
vari:=close>ref(close,1);
追1:=close/ref(close,1)>1.050 and high/close<1.010 and vari>0;
varii:=close/ref(close,1)>1.048 and close=high and between(forcast(vol,4),0.2*forcast(vol,12),2.1*forcast(vol,12));
追2:=filter(varii,28);
追:=追1 or 追2;
stickline(追,close,open,3,0),color7979ff;
{缺口}
drawtext(l>ref(h,1),l,'→'),align1,linethick5,layer7,color9b9bff;
drawtext(ref(l,1)>h,ref(l,1),'←'),align2,linethick5,layer7,color61fe78;
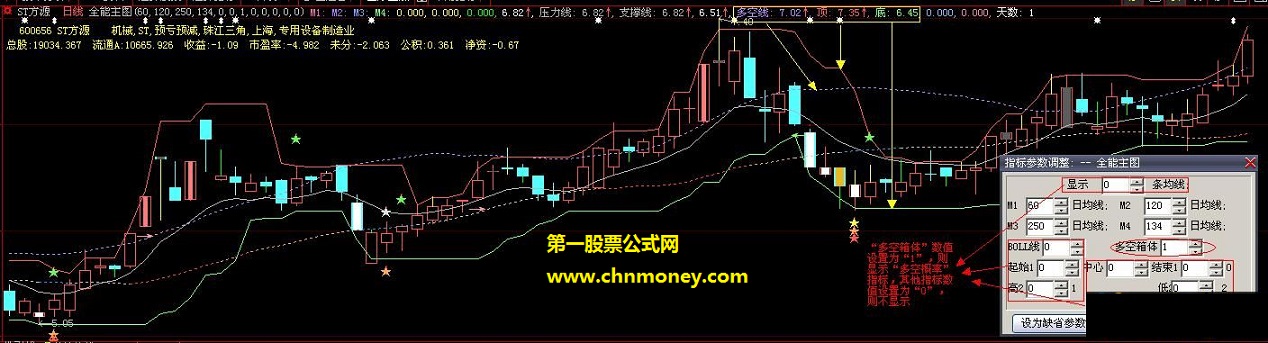
{多空概率-可切换显示}
ma20:=ma(c,20);
多空线:if(min(ma20*1.05,安全线*1.1)*多空箱体>0,min(ma20*1.05,安全线*1.1)*多空箱体,m4),dotline,precis2,colorff89b2;
顶:if(hhv((high+low+open+2*close)/5*2-l,5)*多空箱体>0,hhv((high+low+open+2*close)/5*2-l,5)*多空箱体,m4),precis2,color5b5bff;
底:if(llv((high+low+open+2*close)/5*2-h,8)*多空箱体>0,llv((high+low+open+2*close)/5*2-h,8)*多空箱体,m4),precis2,color6fff6f;
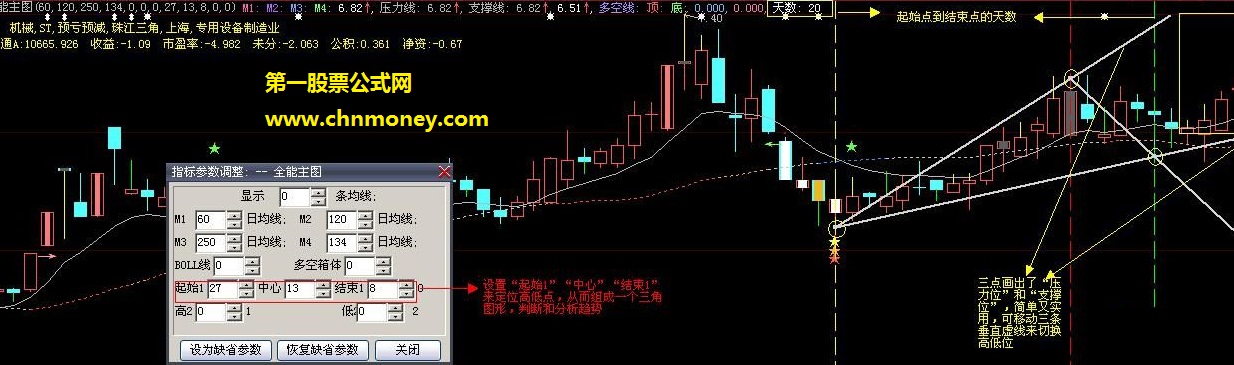
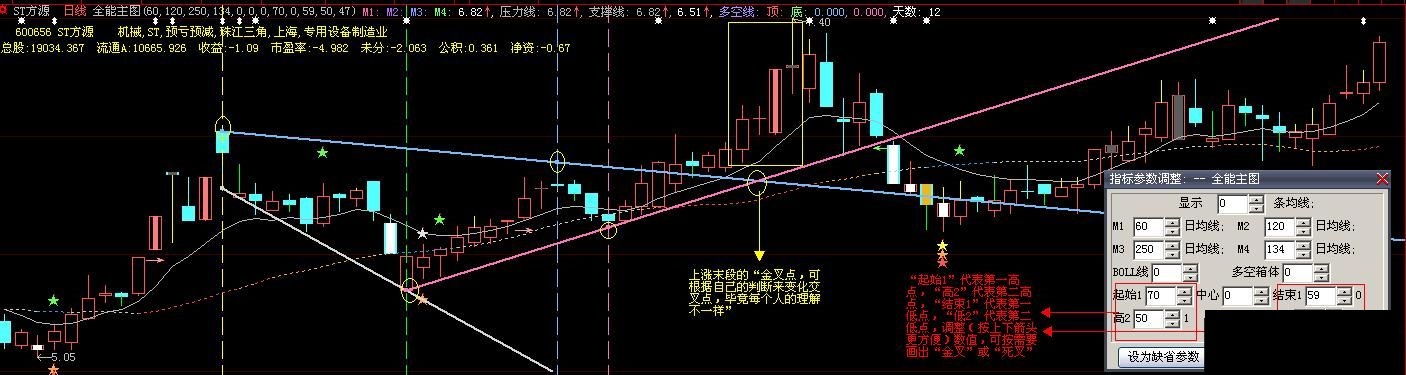
{定点画线-可切换显示}
起始日:=filter(backset(barstatus=2,起始点),起始点);
中心日:=filter(backset(barstatus=2,中心点),中心点);
结束日:=filter(backset(barstatus=2,结束点),结束点);
高二:=filter(backset(barstatus=2,高2),高2);
低二:=filter(backset(barstatus=2,低2),低2);
vertline(起始日,1),layer0,coloryellow;
vertline(中心日,1),layer0,colorred;
vertline(结束日,1),layer0,colorgreen;
vertline(高二,1),layer0,colorffbb77;
vertline(低二,1),layer0,colorba75ff;
drawline(起始日,l,中心日,h,1),linethick2,layer0,colord5d5d5;
drawline(中心日,h,结束日,l,1),linethick2,layer0,colord5d5d5;
drawline(起始日,l,结束日,l,1),linethick2,layer0,colord5d5d5;
drawline(起始日,h,高二,h,1),linethick2,layer0,colorffbb77;
drawline(结束日,l,低二,l,1),linethick2,layer0,colorba75ff;
天数:if(结束点>0,起始点-结束点+1,起始点-中心点+1),precis0,linethick0,colorwhite;
布林线b
{财务信息提取}
zg:=finance2(35);{总股}
lta:=finance2(37);{流通a}
sy:=finance2(3);{收益}
sl:=dynainfo(39);{市盈率}
wf:=finance2(8);{未分}
gj:=finance2(7);{公积};
jz:=finance2(4);{净资}
cw:='总股:'+zg+' 流通a:'+lta+' 收益:'+sy+' 市盈率:'+sl+' 未分:'+wf+' 公积:'+gj+' 净资:'+jz;
drawtextabs(5,24,cw),coloryellow;
drawtextabs(20,8,stklabel+' '+stkname+' '+bkname),coloryellow;
{大盘对比}
大盘涨跌:=(indexc/ref(indexc,1)-1)*100;
个股涨跌:=(c/ref(c,1)-1)*100;
stickline(大盘涨跌<=0 and 个股涨跌>0 and c>o and c<h,h,c,0.1,0),layer3,coloryellow;
stickline(大盘涨跌<=0 and 个股涨跌>0 and c>o and c=h,c,c,6,0),layer3,coloryellow;
stickline(大盘涨跌<=0 and 个股涨跌>0 and c<o and c>l,l,c,0.1,0),layer3,coloryellow;
stickline(大盘涨跌<=0 and 个股涨跌>0 and c<o and c=l,c,c,6,0),layer3,coloryellow;
stickline(大盘涨跌>0 and 个股涨跌<=0 and c<o and c>l,l,c,0.1,0),layer3,colorgreen;
stickline(大盘涨跌>0 and 个股涨跌<=0 and c<o and c=l,c,c,6,0),layer3,colorgreen;
stickline(大盘涨跌>0 and 个股涨跌<=0 and c>o and c<h,h,c,0.1,0),layer3,colorgreen;
stickline(大盘涨跌>0 and 个股涨跌<=0 and c>o and c=h,c,c,6,0),layer3,colorgreen;
{布林线提取}
bbi:="bbi"(3,6,12,24);
bi:=ma(close,20);
bi1:=100*(close-bi)/std(close,20);
bi2:=ema(bi1,10);
中轴线:=(ma(close,3)+ma(close,6)+ma(close,12)+ma(close,24))/4;
partline(中轴线,bi1>bi2 and bi1<-100,rgb(255,172,172),bi1>bi2 and bi1>=-100 and bi1<=170,rgb(255,95,95),bi1>bi2 and bi1>=170,rgb(255,47,47),bi1<bi2 and bi1>0,rgb(30,86,255),bi1<bi2 and bi1<=0,rgb(2,129,255)),precis2,linethick2,layer2,colorwhite;
压力线: bbi+3*std(bbi,10),precis2,layer2,colorb7b7b7;
支撑线: bbi-3*std(bbi,10),precis2,layer2,colorb7b7b7;
安全线:=ma(close,30);
{神奇主图}
操作:=ma((low+high+close)/3,5);
拉升:=hhv(操作,13);
庄压:=hhv(ma(h,13),13);
支撑:=llv(操作,13);
partline(安全线,操作=拉升 and 拉升>ref(拉升,1) and 庄压>ref(庄压,1),rgb(255,70,70),操作=支撑,rgb(47,151,255),庄压>ref(庄压,1),rgb(255,163,75),庄压<=ref(庄压,1),rgb(202,202,202),操作<ref(操作,1) and 庄压=ref(庄压,1) and 拉升=ref(庄压,1),rgb(30,86,255)),precis2,layer2,dotline,colorwhite;
{神偷富贵}
v1:=(close-ma(close,13))/ma(close,13)*300;
varqs3:=ma(v1,17)+ma(v1,17)-ref(ma(v1,17),1);
varqs4:=if(ma(v1,10)<varqs3,varqs3,ma(v1,10));
行情转折平衡线:=varqs4-(ema(v1,3)-varqs4)*1.02;
v2:=(close-llv(low,9))/(hhv(high,9)-llv(low,9))*100;
vara:=ref(low,1);
varb:=(sma(abs(low-vara),3,1))/(sma(max(low-vara,0),3,1))*100;
varc:=ema(if(close*1.3,varb*10,varb/10),3);
vard:=llv(low,13);
vare:=hhv(varc,13);
varf:=if(ma(close,34),1,0);
varg:=(ema(if(low<=vard,(varc+vare*2)/2,0),3))/(618)*varf;
{买点提示}
快:=count(close>ref(close,2),4)/4*100;
慢:=count(close>ref(close,2),6)/6*100;
var1:=llv(low,5);
var2:=hhv(high,5);
快线:= ema((close-var1)/(var2-var1)*100,4) ;
慢线:= ema(0.667*ref(快线,1)+0.333*快线,2);
jc:=(cross(快,1) and 慢<=40) or (cross(慢,20) and 快<=50);
rsv:=(close-llv(low,9))/(hhv(high,3)-llv(low,3))*100;
k:=sma(rsv,3,1);
d:=sma(k,3,1);
j:=3*k-2*d;
快进:=cross(快线,慢线) and 快线<30;
买1:=快=0 and 慢>20 and cross(v1,ref(v1,1));
买2:=快=0 and 慢>20 and cross(ref(行情转折平衡线,1),行情转折平衡线);
买3:=快进 and varg>15;
买4:=快进 and cross(varg<ref(varg,1),0.5);
买5:=快进 and 行情转折平衡线<ref(行情转折平衡线,1) and ref(行情转折平衡线,1)>=30;
关注1:=快=0 and 慢=0;
关注2:=v2<=3 or v2<=varg;
stickline(关注1 or 关注2,close,open,5,0),colorwhite;
一星买点:买1 or 买2,linethick0,precis0,colore1e1e1;
二星买点:快=0 and between(慢,1,20) and cross(v1,ref(v1,1)) and cross(ref(行情转折平衡线,1),行情转折平衡线),linethick0,precis0,colordbff4a;
三星买点:filter(jc,3),linethick0,precis0,color4aff61;
四星买点:买3 or 买4 or 买5,linethick0,precis0,color4afffb;
五星买点:ref(j,1)<0 and j>0,linethick0,precis0,color4aa9ff;
六星买点:cross(快线,慢线) and 慢线<40 and ref(j,1)<0 and j>0,linethick0,precis0,color4a58ff;
{图标提示}
drawtext(一星买点,h*1.02,'★'),colore1e1e1,align1;
drawtext(二星买点,h*1.03,'★'),colordbff4a,align1;
drawtext(三星买点,h*1.04,'★'),color4aff61,align1;
drawtext(四星买点,l*0.99,'★'),color4afffb,align1;
drawtext(五星买点,l*0.98,'★'),color4aa9ff,align1;
drawtext(六星买点,l*0.97,'★'),color4a58ff,align1;
{正反弦}
vaa1:=barscount(close)*3.142/60;
a2:=sin(vaa1*8)*100;
a3:=cos(vaa1*8)*100;
{极限}
极点:=a2>98 or a2<-99 or a3>98 or a3<-99;
stickline( 快线>77 and 极点,close,open,5,0),color5d5d5d;
关注3:=cross(count(关注1,6)=6,0.8);
进仓:=快线<20 and 极点;
stickline(关注3 or 进仓,close,open,5,0),color1fb6ef;
{追涨}
vari:=close>ref(close,1);
varii:=close/ref(close,1)>1.050 and high/close<1.010 and vari>0;
stickline(varii,close,open,3,0),color7979ff;
【好公式网:本指标有未来函数,但是不失为好指标】
>>>使用本站搜索工具可以找到更多“子秦自用第二季-之多功能版全能主图公式下载 大智慧指标第二季”
指标公式下载地址
好公式网提供全网最全的指标公式软件,感谢您的支持!鼠标双击图片可看大图!下载请点击右侧“立即下载”,如只有源码,请点击本页面右侧的导入方法按图导入!
本站指标基于网友分享,仅供研究自学,勿作他用,本站对下载使用不承担任何责任!
上一指标公式:用千钧DDX作持仓线公式下载 大智慧DDX千钧
下一指标公式:见底信号公式下载 大智慧见底
相关大智慧公式推荐
【竞价捉妖】一进二选股公式,刺客出品,实战强,9日锋龙股份涨停,8日康强电子、朗迪集团涨停
老庄涨跌指引主图指标,蕴含老子、庄子哲学,涨跌自水到渠成!
通达信【金矿挖金子】副图指标,红色做多,紫柱是买点!
【拉升破绽之LZC倍缩量】副图/选股公式,浪子缠原创,通达信 源码 效果图
《绝杀5号之首板套利》副图指标,浪子缠原创,近期出票一只涨幅42% 通达信 贴图
根据经典实战战法编制的狮子张口主副图+预警指标,波段利器,适合做波段与中线操作!
浪子回头主图/选股指标 自己研发的 最低价买入 希望大家喜欢
浪子缠原创《LZC新版青蛙跳》 通达信 源码 贴图
《LZC波段底之针尖出麦芒》抄波段底精品 浪子缠原创 通达信 源码 贴图
通达信【秦氏波段先锋】副图指标
浪子缠原创《抄底三剑客》副图指标,益盟版修改成通达信版,源码分享!
浪子缠《第六感预判涨》副图指标,通达信 源码分享
浪子缠《平台突破》副图指标,突破再拉上,通达信 源码 贴图
穿越迷雾副图指标 中线战法 浪子缠原创 盈利百分百 通达信 源码
通达信布林开口笑优化升级版副图指标,多因子量化交易系统!
指标公式下载注意
☉ 好公式网发布的指标公式主要用于软件技术面分析,仅供参考,勿用于实际操作,据此操作风险自负!
☉ 解压密码:www.goodgongshi.com 就是好公式网域名,希望大家看清楚,切勿输错。
☉ tnc和tni格式指标公式,仅可以用通达信软件引入使用,例如可以用通达信软件引入使用指标公式;
☉ tne格式指标公式,仅可以用通达信软件公式编辑器5.0版导入,高版本兼容低版本;
☉ fnc格式指标公式,可以用大智慧软件新一代高速行情分析系统股票软件使用,少部分可以用分析家软件引入使用;
☉ alg格式指标公式,仅仅可以用飞狐交易师软件引入使用;exp格式指标公式,仅可以用大智慧经典版软件引入使用;
☉ hxf格式指标公式,仅可以用同花顺软件引入使用。
☉ 如果您发现下载软件链接错误,请联系管理员报告错误。
☉ 好公式网欢迎各位网友帮忙宣传转发本站网址,有您的支持,我们会做得更好!
☉ 本文子秦自用第二季-之多功能版全能主图公式下载 大智慧指标第二季仅供学习研究。
 粤公网安备 44010602010581号