您的位置:好公式网 → 大智慧公式 → 顾比均线-判断趋势的不二选择L2公式下载 大智慧均线
顾比均线-判断趋势的不二选择L2公式下载 大智慧均线
- 指标公式类型:大智慧公式
- 公式推荐星级:

- 指标公式安全:已通过5款杀毒软件查杀,请放心下载!
- 公式更新时间:2018-07-04 21:59:00
- 指标公式标签:均线
- 公式运行环境: WinXP/Win7/Win8/Win10/Win All
- 指标公式语言:用简体中文编写
指标公式详细说明
好公式网(www.goodgongshi.com)告诉您:当前正要下载:顾比均线-判断趋势的不二选择L2公式下载 大智慧均线
顾比均线-判断趋势的不二选择l2
顾比均线-判断趋势的不二选择
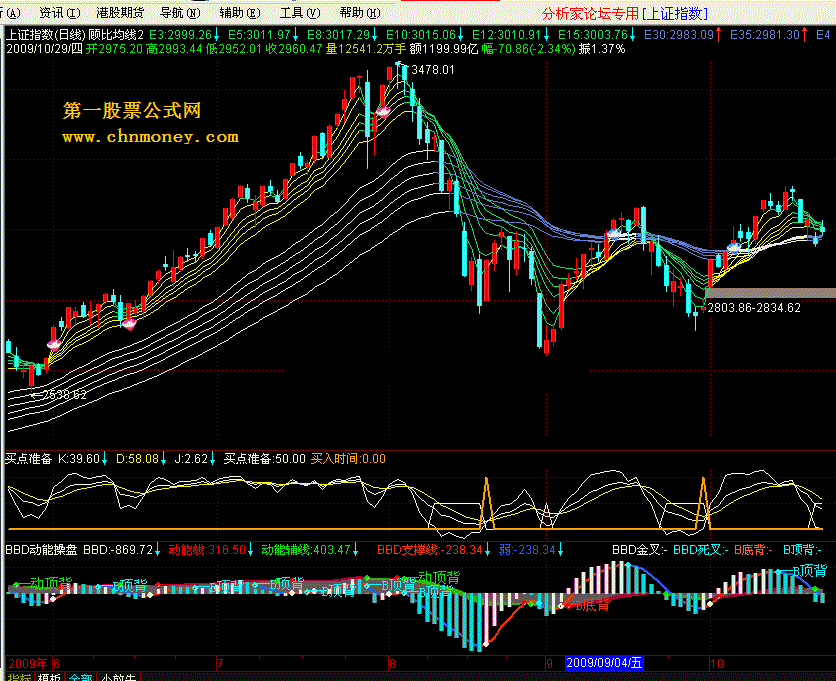
其核心是短期均线组和长期均线组同时出现了价格方向的一致变化,则是交易机会来临的重要信号。
这套短、长两组均线系统,主要用来判断趋势。该均线系统的主要特点是它的视觉效果。当短、长两组均线都处于空头排列时,就像两层厚重的乌云压着k线,形态非常难看。看到这种形态的股票,自然会让投资者望而却步,回避投资风险;当股价穿云破雾,短、长两组均线都处于多头排列时,就像两道彩虹蓬勃而出,其形态格外耀眼夺目。这种k线图形自然吸引投资者的介入,当然也会有比较好的回报。
经过实践运用, 该指标设计了5个趋势临界点,其主要形态是长短期均线向上收敛、粘合、金叉:①长期均线开始收敛,短期均线与长期均线金叉,信号点为蓝色钻石图标;②长短期均线处于强势,短期均线在长期均线上方金叉,信号点为粉色钻石图标;③短期均线和长期均线高度收敛,一阳上穿短期和长期全部均线,信号点为绿色钻石图标;④在长期均线逐步收敛时,短期均线向上突破长期多条均线,短期均线与长期均线金叉,信号点为红底形似白色燕子的图标;⑤出水芙蓉形态,信号点为钱袋子图标。这5个关键点基本满足了6种形态的起涨点。也就是说,最佳买入点就在短期穿长期,长期趋向粘合,短长期粘合共振时,或短期突破长期后再回抽长期均线确认时介入。而这5个关键点基本体现了所描述的最佳买入点!
一旦短期均线组和长期均线组同时出现了价格方向的一致变化,则是交易机会来临的重要信号。当k线远离短期均线时应该回避短期风险,并有计划的减仓。
通达信源码
{顾比均线}
e3:ema(c,3),color61dc16;
e5:ema(c,5),color61dc16;
e8:ema(c,8),color61dc16;
e10:ema(c,10),color61dc16;
e12:ema(c,12),color61dc16;
e15:ema(c,15),color61dc16;
e30:ema(c,30),colord1875a;
e35:ema(c,35),colord1875a;
e40:ema(c,40),colord1875a;
e45:ema(c,45),colord1875a;
e50:ema(c,50),colord1875a;
e60:ema(c,60),colord1875a;
if(e3>ref(e3,1),e3,drawnull),coloryellow;
if(e5>ref(e5,1),e5,drawnull),coloryellow;
if(e8>ref(e8,1),e8,drawnull),coloryellow;
if(e10>ref(e10,1),e10,drawnull),coloryellow;
if(e12>ref(e12,1),e12,drawnull),coloryellow;
if(e15>ref(e15,1),e15,drawnull),coloryellow;
if(e30>ref(e30,1),e30,drawnull),colorff00ff;
if(e35>ref(e35,1),e35,drawnull),colorff00ff;
if(e40>ref(e40,1),e40,drawnull),colorff00ff;
if(e45>ref(e45,1),e45,drawnull),colorff00ff;
if(e50>ref(e50,1),e50,drawnull),colorff00ff;
if(e60>ref(e60,1),e60,drawnull),colorff00ff;
stickline(c>o,c,o,1,0),colorred;
stickline(c>o,h,l,0,0),colorred;
stickline(c<=o,c,o,1,0),colorffff52;
stickline(c<=o,h,l,0,0),colorffff52;
drawicon(ema(c,8)>ema(c,15) and ema(c,40)>ref(ema(c,40),1) and cross(ema(c,3),ema(c,35)),l-0.20,24);
drawicon(ema(c,15)>ema(c,40) and ema(c,35)>ref(ema(c,35),1) and cross(ema(c,3),ema(c,5)),l-0.20,25);
drawicon(abs(ema(c,15)-ema(c,60))/c<0.01 and ema(c,15)>ema(c,30) and o<ema(c,3) and c>ema(c,3) and o<ema(c,15) and c>ema(c,15) and o<ema(c,30) and c>ema(c,30) and o<ema(c,60) and c>ema(c,60),l-0.20,27);
drawicon(abs(ema(c,45)-ema(c,30))/c<0.011 and ema(c,3)>ema(c,15) and ema(c,15)>ema(c,40) and cross(ema(c,5),ema(c,60)),l-0.20,13);
a1:=open<ema(c,20) or open<ema(c,40) or open<ema(c,60);
a2:=c>max(ema(c,20),max(ema(c,40),ema(c,60)));
a3:=v/ma(v,10)>1.2;
a4:=c/ref(c,1)>1.049;
出水芙蓉:=a1 and a2 and a3 and a4 and o<ema(c,60) and c>ema(c,60);
drawicon(出水芙蓉,l-0.20,9);
{顾比均线}(其他股软可用,如大智慧等,选股指标可通用)
e3:ema(c,3),coloryellow;
e5:ema(c,5),coloryellow;
e8:ema(c,8),coloryellow;
e10:ema(c,10),coloryellow;
e12:ema(c,12),coloryellow;
e15:ema(c,15),coloryellow;
e30:ema(c,30),colord1875a;
e35:ema(c,35),colord1875a;
e40:ema(c,40),colord1875a;
e45:ema(c,45),colord1875a;
e50:ema(c,50),colord1875a;
e60:ema(c,60),colord1875a;
stickline(c>o,c,o,4,0),colorred;
stickline(c>o,h,l,0,0),colorred;
stickline(c<=o,c,o,4,0),colorffff52;
stickline(c<=o,h,l,0,0),colorffff52;
drawicon(ema(c,8)>ema(c,15) and ema(c,40)>ref(ema(c,40),1) and cross(ema(c,3),ema(c,35)),l-0.20,1);
drawicon(ema(c,15)>ema(c,40) and ema(c,35)>ref(ema(c,35),1) and cross(ema(c,3),ema(c,5)),l-0.20,1);
drawicon(abs(ema(c,15)-ema(c,60))/c<0.01 and ema(c,15)>ema(c,30) and o<ema(c,3) and c>ema(c,3) and o<ema(c,15) and c>ema(c,15) and o<ema(c,30) and c>ema(c,30) and o<ema(c,60) and c>ema(c,60),l-0.20,1);
drawicon(abs(ema(c,45)-ema(c,30))/c<0.011 and ema(c,3)>ema(c,15) and ema(c,15)>ema(c,40) and cross(ema(c,5),ema(c,60)),l-0.20,1);
a1:=open<ema(c,20) or open<ema(c,40) or open<ema(c,60);
a2:=c>max(ema(c,20),max(ema(c,40),ema(c,60)));
a3:=v/ma(v,10)>1.2;
a4:=c/ref(c,1)>1.049;
出水芙蓉:=a1 and a2 and a3 and a4 and o<ema(c,60) and c>ema(c,60);
drawicon(出水芙蓉,l-0.20,1);
选股指标--顾比临界点
gb1:=ema(c,8)>ema(c,15) and ema(c,40)>ref(ema(c,40),1) and cross(ema(c,3),ema(c,35));
gb2:=ema(c,15)>ema(c,40) and ema(c,35)>ref(ema(c,35),1) and cross(ema(c,3),ema(c,5));
gb3:=abs(ema(c,15)-ema(c,60))/c<0.01 and ema(c,15)>ema(c,30) and o<ema(c,3) and c>ema(c,3) and o<ema(c,15) and c>ema(c,15) and o<ema(c,30) and c>ema(c,30) and o<ema(c,60) and c>ema(c,60);
gb4:=abs(ema(c,45)-ema(c,30))/c<0.011 and ema(c,3)>ema(c,15) and ema(c,15)>ema(c,40) and cross(ema(c,5),ema(c,60));
a1:=open<ema(c,20) or open<ema(c,40) or open<ema(c,60);
a2:=c>max(ema(c,20),max(ema(c,40),ema(c,60)));
a3:=v/ma(v,10)>1.2;
a4:=c/ref(c,1)>1.049;
出水芙蓉:=a1 and a2 and a3 and a4 and o<ema(c,60) and c>ema(c,60);
gb1 or gb2 or gb3 or gb4 or 出水芙蓉;
>>>使用本站搜索工具可以找到更多“顾比均线-判断趋势的不二选择L2公式下载 大智慧均线”
指标公式下载地址
好公式网提供全网最全的指标公式软件,感谢您的支持!鼠标双击图片可看大图!下载请点击右侧“立即下载”,如只有源码,请点击本页面右侧的导入方法按图导入!
本站指标基于网友分享,仅供研究自学,勿作他用,本站对下载使用不承担任何责任!
上一指标公式:神熬组14个-神獒炎率神獒波段等等+图+公式下载 大智慧公式
下一指标公式:反RSI均线-小改‘理想隧道’公式下载 大智慧均线
相关大智慧公式推荐
EXPMA均线5号主图指标 有用法说明 通达信 源码
【疯牛搏杀】牛搏杀指标抓涨停,配合均线K线的形态和成交量一起使用,会起到事半功倍的效果
经典三剑客主图指标 均线、成交量及MACD三者完美结合 通达信 开源 无未来 创新指标
缩量划线突破主图指标,辅助判断缩量点及缩量后方向,通达信、主图、源码、无未来
判断某时期股价盘整开始和结束用的阶段买卖判断副图公式
主力资金进出副图指标,一个能准确判断主力资金进出的工具,源码分享!
分时MAHL,分时主图显示多日均线及昨日高低点,专业做T时用!
使用方便判断直观给出买进参考信号的量势金叉预警副图公式
给大家分享结合了自己看顶底绝技的跟踪判断顶底副图公式
利用技术形态特征来判断控盘底部的关注控盘机会副图公式
同花顺均线黏合爆发副图指标公式
底部无极建仓副图/选股指标,判断个股真底,对中短线有很强实战指导意义!
百年一人老师20多年唯一公布的源代码——主图双均线指标,源码分享!
对个股底部判断及止跌判断都很明确的发现飞龙探底副图公式
以二十一日均线走势为参照编写出来的看高一线副图公式
指标公式下载注意
☉ 好公式网发布的指标公式主要用于软件技术面分析,仅供参考,勿用于实际操作,据此操作风险自负!
☉ 解压密码:www.goodgongshi.com 就是好公式网域名,希望大家看清楚,切勿输错。
☉ tnc和tni格式指标公式,仅可以用通达信软件引入使用,例如可以用通达信软件引入使用指标公式;
☉ tne格式指标公式,仅可以用通达信软件公式编辑器5.0版导入,高版本兼容低版本;
☉ fnc格式指标公式,可以用大智慧软件新一代高速行情分析系统股票软件使用,少部分可以用分析家软件引入使用;
☉ alg格式指标公式,仅仅可以用飞狐交易师软件引入使用;exp格式指标公式,仅可以用大智慧经典版软件引入使用;
☉ hxf格式指标公式,仅可以用同花顺软件引入使用。
☉ 如果您发现下载软件链接错误,请联系管理员报告错误。
☉ 好公式网欢迎各位网友帮忙宣传转发本站网址,有您的支持,我们会做得更好!
☉ 本文顾比均线-判断趋势的不二选择L2公式下载 大智慧均线仅供学习研究。
 粤公网安备 44010602010581号